


 51 / 188


Health systems in transition
Portugal
51
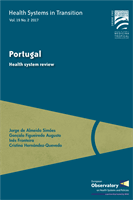
Fig. 3.3
Total health expenditure in US$ purchasing power parity per capita in the
WHO European Region, 2014
Source
: WHO Regional Office for Europe, 2016.
Notes
: European Region: the 53 countries in the WHO European Region; Eur-A: 27 countries in the WHO European Region with very
low child and adult mortality (see WHO definition); Eur-B+C: 26 countries in the WHO European Region with higher levels of mortality
(see WHO definition); CIS: Commonwealth of Independent States; TFYR Macedonia: The former Yugoslav Republic of Macedonia.
0
750
1 500 2 250 3 000 3 750 4 500 5 250 6 000 6750 7 500
CIS
Eur-B+C
EU members since May 2004
European Region
EU
Eur-A
EU members before May 2004
AVERAGES
Tajikistan
Kyrgyzstan
Turkmenistan
Uzbekistan
Armenia
Republic of Moldova
Ukraine
Georgia
Belarus
Azerbaijan
Kazakhstan
Russian Federation
CIS
Albania
TFYR Macedonia
Montenegro
Latvia
Bosnia and Herzegovina
Romania
Serbia
Bulgaria
Poland
Croatia
Estonia
Lithuania
Hungary
Czech Republic
Slovakia
Slovenia
Central and south-eastern Europe
Turkey
Cyprus
Greece
Israel
Portugal
Spain
Malta
Italy
United Kingdom
San Marino
Finland
Ireland
Iceland
Andorra
Belgium
France
Denmark
Austria
Germany
Netherlands
Sweden
Norway
Switzerland
Luxembourg
Monaco
Western Europe
6812.1
2965.8
3071.6
1652.1
1668.3
1068.1
362.1
1595.9
1036.5
2062.4
2098.1
2599.1
2689.9
3238.9
3376.9
3390.2
3701.1
3801.1
3881.7
4272.5
4391.6
4508.1
5038.9
4782.1
5182.1
5201.7
5218.9
6346.6
6468.5
7301.9
1233.1
1237.8
2574.7
3988.3
4020.3
185.1
215.1
319.9
339.6
514.2
584.2
627.7
1047.3
1835.7
614.5
851.1
940.3
957.4
1079.3
1312.2
1398.9
1570.4
1718.0
1826.7
2146.3
2179.1
2697.7
888.2
1031.0
3508.8