


 50 / 188


Health systems in transition
Portugal
50
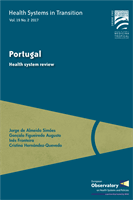
Austerity in Europe also led to the decrease of total health expenditure
in countries like Spain, the United Kingdom or Italy, but that reduction was
sharper in Portugal and Latvia (Fig. 3.2). Despite being among the top spenders
on health care as a percentage of GDP, even after the Economic and Financial
Adjustment Programme, Portugal spent US$ 2689.9 per capita (purchasing
power parity) in 2014, which is below the EU average of US$ 3379 (purchasing
power parity) (Fig. 3.3).
Fig. 3.2
Trends in total health expenditure as a share (%) of GDP in Portugal and selected
countries, 1990–2014
Source
: WHO Regional Office for Europe, 2016.
Between 2010 and 2014, there was a significant decrease in general
government health expenditure in Portugal (–9.7%). Measuring general
government health expenditure as a share of general government expenditure,
Portugal is below the EU average (Fig. 3.5).
5
6
7
8
9
10
11
12
Italy
France
Latvia
United
Kingdom
Spain
Portugal
% GDP
EU
2011
2012
2013
2014
2010
2009
2008
2007
2006
2005
2004
2003
2002
2001
2000
1999
1998
1997
1996
1995