


 166 / 188


Health systems in transition
Portugal
166
Fig. 7.3
Thirty-day mortality after admission, 2013
Source
: OECD, 2016a.
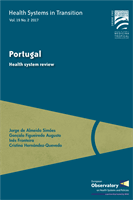
Fig. 7.4
Quality of primary care for chronic conditions – avoidable hospital admissions, 2013
Source
: OECD, 2016a.
0
10
20
30
40
50
UK
Spain
Portugal
Latvia
Italy
Ischaemic stroke
Haemorrhagic stroke
AMI
Age–sex standardized mortality rates per 100 patients
19.1
10.4
8.2
7.5
9.1
45.3
28.3
25.9
22.2
28.3
27.0
10.8 9.9
9.0
10.6
0
50
100
150
200
250
300
Hypertension
CHF
COPD
Asthma
Age-sex standardised rate per 100 patients
95.2
16.9
42.0
30.3
9.8
60.5
161.7
71.6
194.0
119.9
69.8
212.7
131.2
85.7
52.3
180.6
43.5
64.3
194.8
206.0
238.2
267.8
99.4
20.2
13.1
34.3
20.3
12.2
Diabetes-related
conditions