


 154 / 188


Health systems in transition
Portugal
154
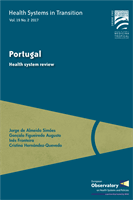
Fig. 7.1
Amenable mortality (a) and preventable mortality (b) in Portugal and selected
countries, 2000–2014
(a)
(b)
Source
: Calculations based on WHO, 2016b.
Note
: List of amenable and preventable mortality as defined by Nolte & McKee, 2004.
2011 2012 2013 2014
2010
2009
2008
2007
2006
2005
2004
2003
2002
2001
2000
50
100
150
200
250
300
350
EU average
United Kingdom
Spain
Portugal
Latvia
Italy
France
DSR per 100 000
40
50
60
70
80
90
2011 2012 2013 2014
2010
2009
2008
2007
2006
2005
2004
2003
2002
2001
2000
EU average
United Kingdom
Spain
Portugal
Latvia
Italy
France
DSR per 100 000